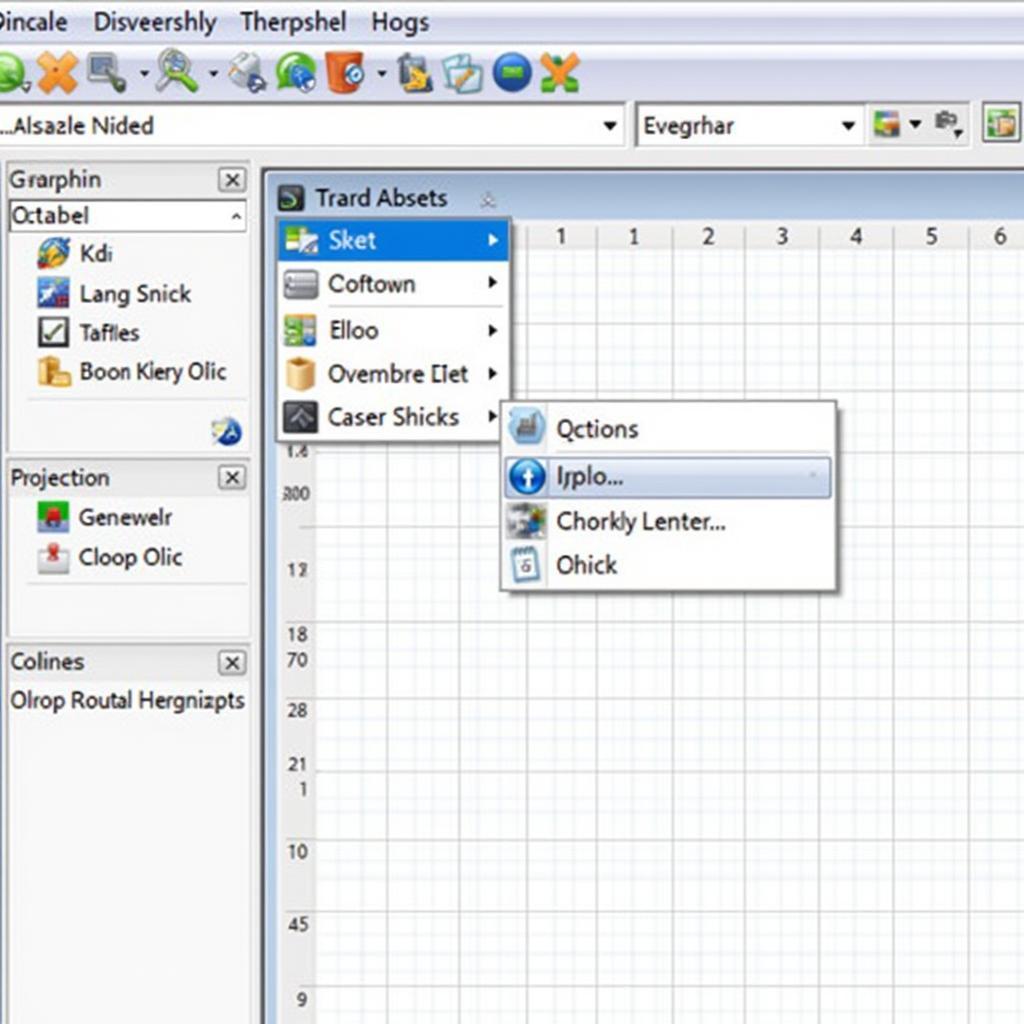
Winplot is a free, powerful, and user-friendly graphing software that allows you to create stunning 2D and 3D graphs. Whether you’re a student, teacher, or professional, Winplot provides the tools you need to visualize mathematical concepts, analyze data, and create high-quality presentations. This comprehensive guide will walk you through everything you need to know about downloading and using Winplot.
Why Choose Winplot?
Winplot stands out for its simplicity, versatility, and comprehensive features. Unlike other complex graphing software, Winplot boasts an intuitive interface that’s easy to navigate, even for beginners. It supports a wide range of graph types, from basic functions to parametric equations and differential equations, making it an indispensable tool for various mathematical disciplines.
 Winplot Interface
Downloading and Installing Winplot
Getting started with Winplot is quick and straightforward. Follow these simple steps:
- Visit the Source: Download Winplot from the official website of its developer, Peanut Software, or trusted software repositories. Ensure you choose the appropriate version for your operating system (Windows).
- Run the Installer: Locate the downloaded file (usually a .zip file) and extract its contents. Run the setup file (e.g., wp32z.exe) to begin the installation process.
- Follow the Prompts: The installation wizard will guide you through the setup. You can typically use the default settings, which are suitable for most users.
- Launch Winplot: Once installed, you can find Winplot in your start menu or on your desktop, depending on your chosen installation options.
Exploring Winplot’s Features
Winplot offers a plethora of features that cater to both basic and advanced graphing needs.
2D Graphing
Create a wide variety of 2D graphs, including:
- Explicit Functions: Plot graphs of functions in the form y = f(x).
- Implicit Functions: Visualize equations that are not easily expressed as y = f(x).
- Parametric Equations: Define curves using parametric equations, ideal for representing motion or curves in space.
- Polar Coordinates: Explore graphs in polar coordinates, particularly useful for visualizing circular or spiral patterns.
3D Graphing
Visualize complex mathematical relationships with stunning 3D graphs:
- Explicit Functions: Plot 3D surfaces defined by functions of two variables (z = f(x,y)).
- Parametric Surfaces: Represent surfaces using parametric equations, allowing for intricate and dynamic shapes.
- Contour Plots: Generate contour maps to visualize the level curves of a 3D surface.
Customization and Export
Winplot allows for extensive customization to tailor your graphs to your preferences:
- Appearance: Modify line styles, colors, thicknesses, point markers, and axis labels.
- Labels and Legends: Add descriptive labels to your graphs and create legends to differentiate multiple datasets.
- Export Options: Save your graphs in various formats, including bitmap images (.bmp, .png, .jpg), vector graphics (.eps), and even animated GIFs to illustrate dynamic concepts.
Winplot in Action: Real-World Applications
Winplot’s versatility makes it a valuable tool across disciplines:
- Education: Teachers can use Winplot to demonstrate mathematical concepts visually, while students can benefit from interactive visualizations to deepen their understanding.
- Research: Scientists and engineers can utilize Winplot for data analysis, function fitting, and creating publication-quality graphs.
- Engineering and Design: Visualize 3D models, analyze curves and surfaces, and create technical illustrations.
Tips for Using Winplot Effectively
- Start with the Basics: Familiarize yourself with the interface and basic functionalities before diving into advanced features. Numerous online tutorials and resources can guide you.
- Leverage the Help File: Winplot has a comprehensive built-in help file that provides detailed explanations and examples for all its features.
- Join the Community: Engage with the active Winplot community online to seek help, share tips, and discover new ways to use the software.
Conclusion
Winplot is a powerful, versatile, and accessible graphing tool that empowers users of all levels to explore the fascinating world of mathematics and data visualization. Its user-friendly interface, extensive features, and free availability make it an invaluable asset for students, educators, and professionals alike. Download Winplot today and unlock a world of graphing possibilities.
FAQs
Is Winplot really free?
Yes, Winplot is completely free to download and use for both personal and educational purposes.
What operating systems does Winplot support?
Winplot is primarily designed for Windows operating systems.
Can I use Winplot for commercial projects?
While Winplot is primarily intended for non-commercial use, you can contact the developer, Peanut Software, for information about commercial licensing.
Does Winplot require any programming knowledge?
No, Winplot does not require any programming knowledge. Its intuitive interface allows users to create graphs easily using menus and dialog boxes.
Where can I find help and support for Winplot?
The Winplot website, online forums, and user communities offer a wealth of resources, tutorials, and support for users of all levels.
Can I import data from other programs into Winplot?
Yes, Winplot allows you to import data from text files, making it compatible with data exported from spreadsheets and other programs.
Does Winplot support animation?
Yes, Winplot supports creating animated GIFs, enabling you to visualize dynamic processes and mathematical concepts.
Need assistance with your graphing needs? Contact us at:
Phone: +84966819687
Email: squidgames@gmail.com
Address: 435 Quang Trung, Uông Bí, Quảng Ninh 20000, Vietnam.
Our dedicated customer support team is available 24/7 to assist you. Explore other informative articles and resources on our website for further assistance.